Monitoring
Here I present a working solution for deploying a complete monitoring stack in a single node within a Kubernetes cluster, intended for non-production environments. Logs and metrics are stored locally on the node’s file system. Although this setup is not suitable for production use, it serves as a valuable learning opportunity for understanding how to deploy and configure these components. It can be useful for local development and testing, and it provides foundational knowledge for working with distributed and production environments.
The end result is a system that can collect telemetries at a single endpoint using a standard interface, and display informations like in the following pictures:


Examples are in the ./examples/09-monitoring folder of the repository.
Cloud-native systems are often distributed using Helm charts. I haven’t used Helm much so far because I wanted to first learn the basics of Kubernetes. However, now it's time to install it and start using it.
Introduction to Helm
Helm is a package manager for Kubernetes, which simplifies deploying and managing applications on Kubernetes clusters through the use of "charts" - packages of pre-configured Kubernetes resources.
With Helm, you can:
- Install complex applications with a single command.
- Automatically manage dependencies between components.
- Upgrade applications seamlessly.
- Roll back to previous versions when needed.
- Share application configurations through a repository system.
Helm uses a templating system that makes it easy to customize deployments while maintaining consistency across environments.
An alternative to Helm is Kustomize, which is built into kubectl and allows you to
customize Kubernetes configurations without templates. I plan to later learn how to
create Helm charts and use Kustomize as well, but for now, I will focus on using
existing Helm charts to deploy monitoring systems.
Installing Helm
Like described in the official documentation:
- Download your desired version from GitHub.
- Unpack it (
tar -zxvf helm-v3.0.0-linux-amd64.tar.gz). - Find the helm binary in the unpacked directory, and move it to its desired destination
(
mv linux-amd64/helm /usr/local/bin/helm).
Example, at the time of this writing:
cd /tmp/

wget https://get.helm.sh/helm-v3.19.0-linux-amd64.tar.gz

tar -zxvf helm-v3.19.0-linux-amd64.tar.gz

sudo mv linux-amd64/helm /usr/local/bin/helm

# verify installation
helm version
And that's it. 
Introduction to Observability
Observability is the ability to understand the internal state of a system based on the data it produces — typically through:
- Metrics: Numerical time-series data (e.g., CPU usage, request latency)
- Logs: Text records of events (e.g., errors, warnings)
- Traces: End-to-end records of requests across services
| Record Type | Description | Storage Examples |
|---|---|---|
| Metrics | Numerical measurements collected at regular intervals. Structured, time-series data (e.g., CPU usage, RAM usage). | Prometheus, InfluxDB |
| Logs | Timestamped records of discrete events. Log entries generated by applications, often collected using log shippers or agents. | Loki, Elasticsearch |
| Traces | Records showing request paths through distributed systems. Provide insights into the flow of requests across services, often collected using tracing libraries. | Jaeger, Tempo |
There are many tools available for collecting, storing, and visualizing each type of data. For instance, a popular choice for a complete observability stack is the combination of Prometheus for metrics, Loki for logs, and Jaeger for traces, all visualized through Grafana. But this is just one of many possible combinations of tools.
A simple overview of how these components can work together in a monitoring setup that supports only metrics is as follows:
graph LR
    A[Applications] -->|Send Metrics| B[Prometheus]
    B -->|Data| C[Grafana]
    C -->|Visualization| D[User]
In practice, however, applications need to handle not just metrics but also logs and traces. To simplify the collection of different kinds of records, a Telemetry Collector component is used as a central component that can receive, process, and export all three types of telemetry data.
A more realistic and complete overview of a modern monitoring setup looks like this:
graph TD
    subgraph "Monitoring Stack"
        direction TB
        A[Applications] -->|Send **Metrics**| O[Telemetry Collector<br/>e.g. **OpenTelemetry Collector<br>or Grafana Alloy**] -->|*Metrics*| B[Metrics service<br/>e.g. **Prometheus or InfluxDB**]
        A -->|Send **Logs**| O -->|*Logs*| E[Logs service<br/>e.g. **Loki or Elasticsearch**]
        A -->|Send **Traces**| O -->|*Traces*| F[Traces service<br/>e.g. **Jaeger or Tempo**]
        B -->|*data source for…*| C[**Grafana**]
        E -->|*data source for…*| C
        F -->|*data source for…*| C
        C -->|Visualization| D[User]
    end
Data Flow and Storage
- Applications: These are your services or applications that generate telemetry data (metrics, logs, traces). They can be instrumented to send this data to the OpenTelemetry Collector.
- OpenTelemetry Collector: This component receives telemetry data from applications. It can process, filter, and export this data to various backends for storage and querying. It offers a common vendor-agnostic interface (OTLP) for receiving telemetry data.
- Storage Backends: These are specialized services that store different types of telemetry data: metrics, logs, and traces.
- Grafana: This is the visualization layer that connects to the various storage backends. It allows users to create dashboards and panels to visualize and analyze the telemetry data.
Each storage backend stores and indexes its respective data type, allowing for efficient querying and retrieval.
OpenTelemetry in a Few Words
OpenTelemetry was "born" in May 2019 when the two leading open-source observability projects, OpenTracing and OpenCensus, merged to form a single, unified standard. This merger was driven by the desire to standardize the collection of telemetry data (traces, metrics, and logs) and eliminate vendor lock-in, ultimately creating a vendor-neutral framework for collecting and exporting observability data.
Today OpenTelemetry is an open-source observability framework that provides a set of tools, APIs, and SDKs for collecting and exporting telemetry data (metrics, logs, traces) from applications and services. It is a project under the Cloud Native Computing Foundation (CNCF) and is widely adopted in the cloud-native ecosystem.
Installing Components
For my exercise, I will install the following components in my Kubernetes cluster:
- Prometheus: For collecting and storing metrics.
- Grafana Loki: For collecting and storing logs.
- Grafana Tempo: For collecting and storing traces.
- Grafana: For visualizing metrics, logs, and traces.
- OpenTelemetry Collector: For the telemetry collector offering a common interface to collect metrics, logs, and traces, and supporting the OTLP standard interface.
I will configure Persistent Volumes to ensure data durability across pod restarts.
Grafana alternative to OpenTelemetry Collector.
Grafana offers a component that can be used as alternative to the OpenTelemetry Collector: Grafana Alloy.
Grafana Alloy is an open-source, vendor-neutral telemetry collector developed by Grafana Labs. It is designed to collect, process, and forward logs, metrics, and traces from your infrastructure to various backends, including Grafana Cloud, Prometheus, Loki, Tempo, and others.
Similarities to OpenTelemetry Collector:
- Both are telemetry collectors that can receive, process, and export observability data (metrics, logs, traces).
- Both support pipelines for transforming and routing data.
- Both are extensible and support multiple protocols and backends.
- Grafana Alloy supports OTLP (OpenTelemetry Protocol) for both metrics and traces. Alloy can receive OTLP data over gRPC and HTTP, making it compatible with OpenTelemetry SDKs and agents.
Differences:
- Alloy is built by Grafana Labs and is designed to work seamlessly with the Grafana stack (Prometheus, Loki, Tempo, etc.), but is also vendor-neutral.
- OpenTelemetry Collector is a CNCF project and is the reference implementation for the OpenTelemetry standard, aiming for broad interoperability across vendors and formats.
- Alloy has a configuration and extension model inspired by Prometheus Agent and supports Prometheus scraping natively.
Summary:
Grafana Alloy and OpenTelemetry Collector serve similar purposes, but Alloy is more tightly integrated with the Grafana ecosystem, while OpenTelemetry Collector is more general-purpose and standards-focused.
Installing Prometheus
First add the necessary repository to Helm:
helm repo add prometheus-community https://prometheus-community.github.io/helm-charts
helm repo update
Then install Prometheus using the community Helm chart:
helm install prometheus prometheus-community/prometheus \
   --namespace monitoring --create-namespace \
   --set server.ingress.enabled=true \
   --set server.ingress.hosts={prometheus.local}
In this case, I want to enable ingress to access the Prometheus UI from localhost on the
hostname prometheus.local. I also want to deploy Prometheus in the monitoring
namespace.
Like done previously for other examples, add an entry to hosts:
Open http://prometheus.local in your browser.
To see what was created, you can run:
Note that the Prometheus chart by default uses local storage for the Prometheus server,
as visible with kubectl get pvc -n monitoring. The PVC folders are created at
/var/lib/k3s/storage on the host, since I am using k3s.
Installing Grafana
The following will install the Grafana visualization platform in the same
monitoring namespace, with ingress enabled to access it from outside the cluster:
helm install grafana grafana/grafana \
  --namespace monitoring --create-namespace \
  --set ingress.enabled=true \
  --set ingress.hosts={grafana.local} \
  --set persistence.enabled=true \
  --set persistence.size=10Gi
The output should show instructions to get the admin password and sign-in to Grafana, like:
helm install grafana grafana/grafana \
  --namespace monitoring --create-namespace \
  --set ingress.enabled=true \
  --set ingress.hosts={grafana.local} \
  --set persistence.enabled=true \
  --set persistence.size=10Gi
NAME: grafana
LAST DEPLOYED: Thu Sep 18 13:08:00 2025
NAMESPACE: monitoring
STATUS: deployed
REVISION: 1
NOTES:
1. Get your 'admin' user password by running:

   kubectl get secret --namespace monitoring grafana -o jsonpath="{.data.admin-password}" | base64 --decode ; echo


2. The Grafana server can be accessed via port 80 on the following DNS name from within your cluster:

   grafana.monitoring.svc.cluster.local

   If you bind grafana to 80, please update values in values.yaml and reinstall:
   securityContext:
     runAsUser: 0
     runAsGroup: 0
     fsGroup: 0

   command:
   - "setcap"
   - "'cap_net_bind_service=+ep'"
   - "/usr/sbin/grafana-server &&"
   - "sh"
   - "/run.sh"
   Details refer to https://grafana.com/docs/installation/configuration/#http-port.
   Or grafana would always crash.

   From outside the cluster, the server URL(s) are:
     http://grafana.local

3. Login with the password from step 1 and the username: admin
Add an entry to hosts:
Then navigate to http://grafana.local in your browser. It should display the Grafana login page.
Enter the username admin and the password retrieved from the command shown in the
output above.
At this point, Grafana is not so interesting because it has no data source configured.
Once logged in, you can bind Prometheus as a data source. You can obtain the DNS
name of the Prometheus service by running kubectl get svc -n monitoring to see which services were deployed by the Helm chart.
In this case, we are interested in prometheus-server:
kubectl get svc -n monitoring

NAME                                  TYPE        CLUSTER-IP      EXTERNAL-IP   PORT(S)    AGE
grafana                               ClusterIP   10.43.169.186   <none>        80/TCP     18m
prometheus-alertmanager               ClusterIP   10.43.83.222    <none>        9093/TCP   56m
prometheus-alertmanager-headless      ClusterIP   None            <none>        9093/TCP   56m
prometheus-kube-state-metrics         ClusterIP   10.43.71.6      <none>        8080/TCP   56m
prometheus-prometheus-node-exporter   ClusterIP   10.43.90.133    <none>        9100/TCP   56m
prometheus-prometheus-pushgateway     ClusterIP   10.43.178.124   <none>        9091/TCP   56m
prometheus-server                     ClusterIP   10.43.248.242   <none>        80/TCP     56m
We must use the DNS name prometheus-server.monitoring.svc.cluster.local as the URL
when adding a new data source in Grafana (<service-name>.<namespace>.svc.cluster.local).
Installing Loki
There are a few ways to install Loki. Since I am currently interested in hosting local environments using filesystem storage, I am interested in a chart that deploys Loki to a single node.
Beware of some outdated documentation…
Initially I followed the documentation at: Install the monolithic Helm chart, but this documentation is
outdated as it suggests using a chart named loki-stack, which is deprecated
and not working anymore like documented. I lost hours trying to make this work,
and finally had success using the loki chart.
The article by Aswin Vijayan, How to Setup Grafana Loki on Kubernetes & Query Logs was helpful. 
The ./examples/09-monitoring folder contains an example that works (at this time)
to install Grafana Loki on a Kubernetes cluster. This file is configured to
use Loki using the SingleBinary mode and store files on the node's file system
using the local-path provider.
The command should display an output like the following:
NAME: loki
LAST DEPLOYED: Sun Sep 21 17:08:30 2025
NAMESPACE: monitoring
STATUS: deployed
REVISION: 1
NOTES:
***********************************************************************
 Welcome to Grafana Loki
 Chart version: 6.40.0
 Chart Name: loki
 Loki version: 3.5.3
***********************************************************************

** Please be patient while the chart is being deployed **

Tip:

  Watch the deployment status using the command: kubectl get pods -w --namespace monitoring

If pods are taking too long to schedule make sure pod affinity can be fulfilled in the current cluster.

***********************************************************************
Installed components:
***********************************************************************
* loki

Loki has been deployed as a single binary.
This means a single pod is handling reads and writes. You can scale that pod vertically by adding more CPU and memory resources.


***********************************************************************
Sending logs to Loki
***********************************************************************

Loki has been configured with a gateway (nginx) to support reads and writes from a single component.

You can send logs from inside the cluster using the cluster DNS:

http://loki-gateway.monitoring.svc.cluster.local/loki/api/v1/push

You can test to send data from outside the cluster by port-forwarding the gateway to your local machine:

  kubectl port-forward --namespace monitoring svc/loki-gateway 3100:80 &

And then using http://127.0.0.1:3100/loki/api/v1/push URL as shown below:

curl -H "Content-Type: application/json" -XPOST -s "http://127.0.0.1:3100/loki/api/v1/push"  \
--data-raw "{\"streams\": [{\"stream\": {\"job\": \"test\"}, \"values\": [[\"$(date +%s)000000000\", \"fizzbuzz\"]]}]}"

Then verify that Loki did receive the data using the following command:

curl "http://127.0.0.1:3100/loki/api/v1/query_range" --data-urlencode 'query={job="test"}' | jq .data.result

***********************************************************************
Connecting Grafana to Loki
***********************************************************************

If Grafana operates within the cluster, you'll set up a new Loki datasource by utilizing the following URL:

http://loki-gateway.monitoring.svc.cluster.local/
Go back to Grafana, and add Loki as a data source, using the URL:
http://loki-gateway.monitoring.svc.cluster.local/ - this can require waiting
for a few minutes.
To test sending data to Loki, you can do it following the instructions of the Loki installer:
# in one terminal…
kubectl port-forward --namespace monitoring svc/loki-gateway 3100:80

# in another terminal…
curl -H "Content-Type: application/json" -XPOST -s "http://127.0.0.1:3100/loki/api/v1/push"  --data-raw "{\"streams\": [{\"stream\": {\"job\": \"test\"}, \"values\": [[\"$(date +%s)000000000\", \"fizzbuzz\"]]}]}"
Logs are visible in the Grafana UI, like in the following picture:
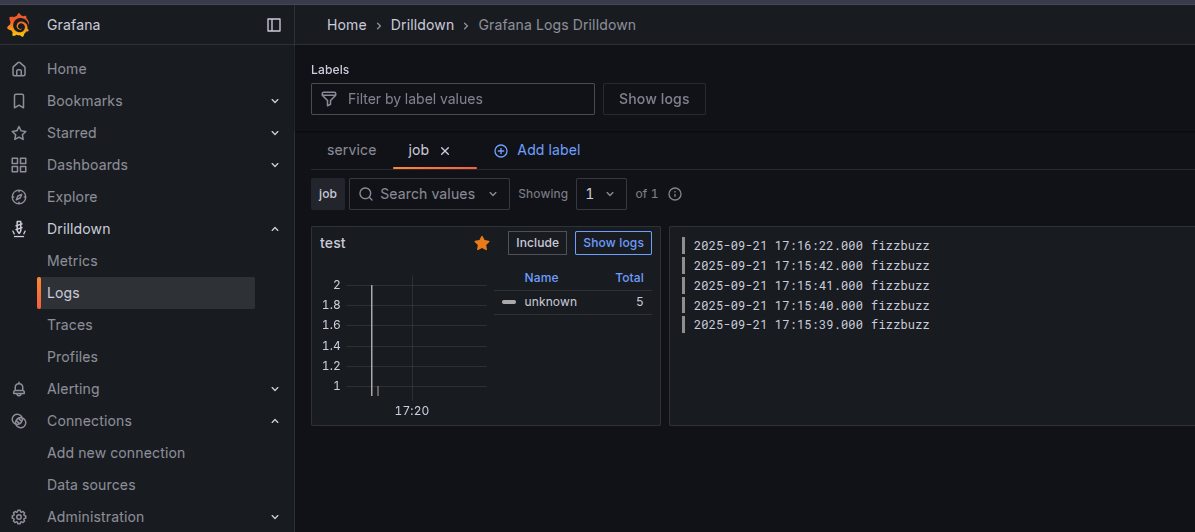
More logs are visible, such as:
2025-09-21 17:22:55.633
1758468175633109694 ppppppppppppppppppppppppppppppppppppppppppppppppppppppppppppppppppppppppppppppp
These are test log entries generated by the Loki Helm chart’s installation instructions or by manual test commands.
Installing Tempo
To support traces, I want to install a service that can handle them. Since I am using Grafana for other components, I opt for Grafana Tempo.

To see the default values of the chart:
In this case, I create first PVCs and then deploy tempo to persist data on the local file system.
kubectl apply -f tempo-pvc.yaml -n monitoring

helm install tempo grafana/tempo -n monitoring --create-namespace -f tempo-values.yaml
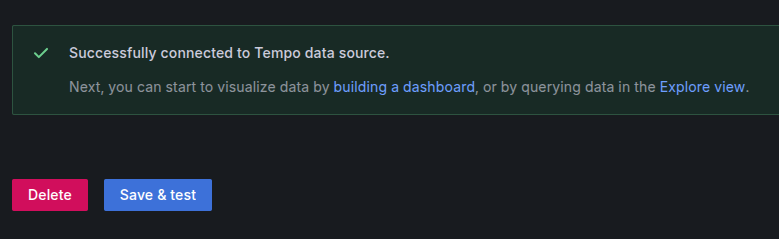
Go back to Grafana and add a Tempo data source using the URL:
http://tempo.monitoring.svc.cluster.local:3200/.
Installing OpenTelemetry Collector
Let's start by adding the OpenTelemetry Helm repository:
# Add OpenTelemetry Helm repository
helm repo add open-telemetry https://open-telemetry.github.io/opentelemetry-helm-charts
helm repo update
To investigate all possible options, you can use the following command to obtain the default values for the Helm chart:
The ./examples/09-monitoring/otel-collector-values.yaml file in this repository
contains a working example. You can deploy the collector using Helm:
helm install opentelemetry-collector open-telemetry/opentelemetry-collector \
  --namespace monitoring \
  --values otel-collector-values.yaml
The configuration file for the OpenTelemetry Collector must be well configured to send metrics to Prometheus, logs to Loki, and traces to Tempo.
If something goes wrong, inspect the logs of the OpenTelemetry Collector pod. I had to inspect the logs a few times to get the configuration of the endpoints right, especially for this piece of configuration:
  exporters:
    prometheus:
      endpoint: 0.0.0.0:8889
      namespace: otel
    otlp/tempo: # Grafana Tempo
      endpoint: tempo.monitoring.svc.cluster.local:4317
      tls:
        insecure: true # Set to true if not using TLS
    # Ref: https://grafana.com/docs/loki/latest/send-data/otel/
    otlphttp: # Grafana Loki
      endpoint: http://loki-gateway.monitoring.svc.cluster.local/otlp/
Test Sending Telemetries from an Application
Now it is time to test sending telemetries to the OpenTelemetry Collector. For this purpose, I modified my Fortune Cookie application to support sending traces and logs using the OpenTelemetry SDK and the OTLP protocol.
The application source code is available here on GitHub: RobertoPrevato/SQLiteWebDemo.
If you didn't follow the previous exercise where I deployed this application to Kubernetes, please do it now, following the instructions in my K3s introduction.
Once you have a running application like in the previous exercise, you can modify the existing deployment to apply the necessary configuration to enable OpenTelemetry, by running:
Note how the deployment now contains environment variables to configure OpenTelemetry:
            - name: OTEL_EXPORTER_OTLP_ENDPOINT
              value: http://opentelemetry-collector.monitoring.svc.cluster.local:4318
            - name: OTEL_RESOURCE_ATTRIBUTES
              value: service.name=fortunecookies,service.namespace=fortunecookies,service.version=0.0.2,deployment.environment=local
            - name: OTEL_EXPORTER_OTLP_PROTOCOL
              value: "http/protobuf"
| Variable | Description |
|---|---|
OTEL_EXPORTER_OTLP_ENDPOINT |
The endpoint of the OpenTelemetry Collector to which the application will send telemetry data. This is the URL of the service accessible inside the Kubernetes cluster. |
OTEL_RESOURCE_ATTRIBUTES |
Attributes that provide metadata about the service, such as its name, namespace, version, and deployment environment. |
OTEL_EXPORTER_OTLP_PROTOCOL |
The protocol used to communicate with the OpenTelemetry Collector: "http/protobuf". |
OTEL_RESOURCE_ATTRIBUTES is particularly useful for identifying and filtering telemetry data in the monitoring backend. When multiple services are sending data to the same collector, these attributes help filtering and navigating the data in the Grafana UI.
The demo application is configured to send traces and logs to the OpenTelemetry Collector for each web request (using a middleware), and has some dedicated endpoints to generate test logs and traces.
| Endpoint | Description |
|---|---|
GET /cookies/api/otel-tests/test |
Logs a warning, a dependency call with random delay between 0.1 and 1.5s, and an extra trace for the request. |
GET /cookies/api/otel-tests/crash |
Simulates a crash by throwing an exception. |
GET /cookies/api/otel-tests/{name} |
Returns a Hello, {name}. |
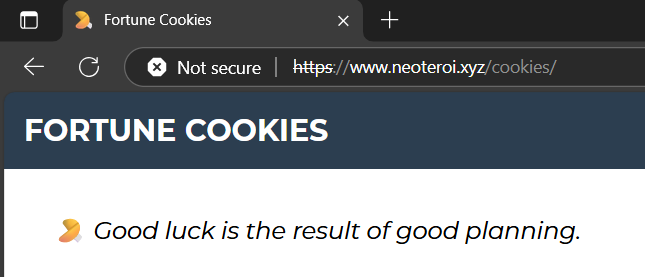
Testing these endpoints generates logs and traces that can be inspected in
Grafana, like shown in the following picture and the pictures at the beginning
of this post. The fortune cookies app includes a Swagger interface, accessible
at https://www.neoteroi.xyz/cookies/docs if you followed the instructions.
Otherwise, use curl to generate some web requests:

Traces, custom events, unhandled exceptions with stack traces, logs, and dependency calls are visible and working in the Grafana UI.
It is worth noting that:
- The application generating logs is using the OTLP protocol and
simply changing the
OTEL_EXPORTER_OTLP_ENDPOINTenvironment variable to point to a different collector would allow sending logs and traces to a different backend, such as a cloud provider's managed OpenTelemetry service. - The demo application is written in Python, but OpenTelemetry SDKs are available for many programming languages.
Improved Monitoring
Earlier in this exercise I installed the plain-vanilla Prometheus and Grafana Helm charts. These were useful to understand the monitoring stack and start making experience with Prometheus and Grafana. These would require configuring many things explicitly, for instance, to collect CPU and RAM utilization of pods in Kubernetes. There is a better option: switching to the Prometheus Operator Helm chart. This includes several benefits:
- Automatically discovers
PodMonitors. - No manual scrape configuration needed.
# Uninstall current Grafana and Prometheus
helm uninstall grafana -n monitoring
helm uninstall prometheus -n monitoring

# Install the kube-prometheus-stack
helm install kube-prometheus-stack prometheus-community/kube-prometheus-stack -n monitoring \
  --set prometheus.ingress.enabled=true \
  --set prometheus.ingress.hosts[0]=prometheus.local \
  --set grafana.ingress.enabled=true \
  --set grafana.ingress.hosts[0]=grafana.local \
  --set alertmanager.ingress.enabled=true \
  --set alertmanager.ingress.hosts[0]=alertmanager.local \
  --set prometheus.prometheusSpec.podMonitorSelectorNilUsesHelmValues=false \
  --set prometheus.prometheusSpec.serviceMonitorSelectorNilUsesHelmValues=false \
  --set grafana.adminPassword='<your-desired-password>'
The output of the command above should look like:
NAME: kube-prometheus-stack
LAST DEPLOYED: Mon Oct 20 12:32:33 2025
NAMESPACE: monitoring
STATUS: deployed
REVISION: 1
NOTES:
kube-prometheus-stack has been installed. Check its status by running:
  kubectl --namespace monitoring get pods -l "release=kube-prometheus-stack"

Get Grafana 'admin' user password by running:

  kubectl --namespace monitoring get secrets kube-prometheus-stack-grafana -o jsonpath="{.data.admin-password}" | base64 -d ; echo

Access Grafana local instance:

  export POD_NAME=$(kubectl --namespace monitoring get pod -l "app.kubernetes.io/name=grafana,app.kubernetes.io/instance=kube-prometheus-stack" -oname)
  kubectl --namespace monitoring port-forward $POD_NAME 3000

Visit https://github.com/prometheus-operator/kube-prometheus for instructions on how to create & configure Alertmanager and Prometheus instances using the Operator.
Sign-in to Grafana UI again using the new password, and since we recreated Grafana,
add again the Loki and Tempo data sources like described above in this article.
These settings ensure that Prometheus automatically scrapes PodMonitors installed in all namespaces:
  --set prometheus.prometheusSpec.podMonitorSelectorNilUsesHelmValues=false \
  --set prometheus.prometheusSpec.serviceMonitorSelectorNilUsesHelmValues=false \
Now Prometheus includes a set of useful dashboards for Kubernetes. It looks great!
Now Grafana includes many useful dashboards, offering a view on many auto-discovered metrics, including CPU and RAM utilization for all namespaces and pods.


Summary
In this article, I demonstrated how to deploy a complete monitoring stack in a single node of a Kubernetes cluster using Helm charts and configuration files. The stack includes Prometheus for metrics, Grafana Loki for logs, Grafana Tempo for traces, and Grafana for visualization. I also deployed the OpenTelemetry Collector to receive telemetry data from applications, and showed how to configure a demo application to send logs and traces using the OTLP protocol.
I had lots of fun doing this exercise, and I learned a lot about deploying and configuring these components. In some cases, the documentation was lacking or outdated, so I had to experiment and proceed by trial and error.
What is missing from this exercise is configuring Prometheus to scrape metrics from the OpenTelemetry Collector, which I plan to do later. Logs and traces are the kinds of records I care about collecting from applications the most at the moment.
Last modified on: 2025-10-26 18:45:09